

Early indications of 'high average protein levels' for GB wheat, says AHDB Cereals
The average protein level for GB wheat harvested in 2016 is at the highest level for 10 years, according to the provisional results of AHDB Cereals & Oilseeds’ Cereal Quality Survey 2016.
Meanwhile, the provisional results for barley indicate a smaller specific weight and grain size than in previous years.
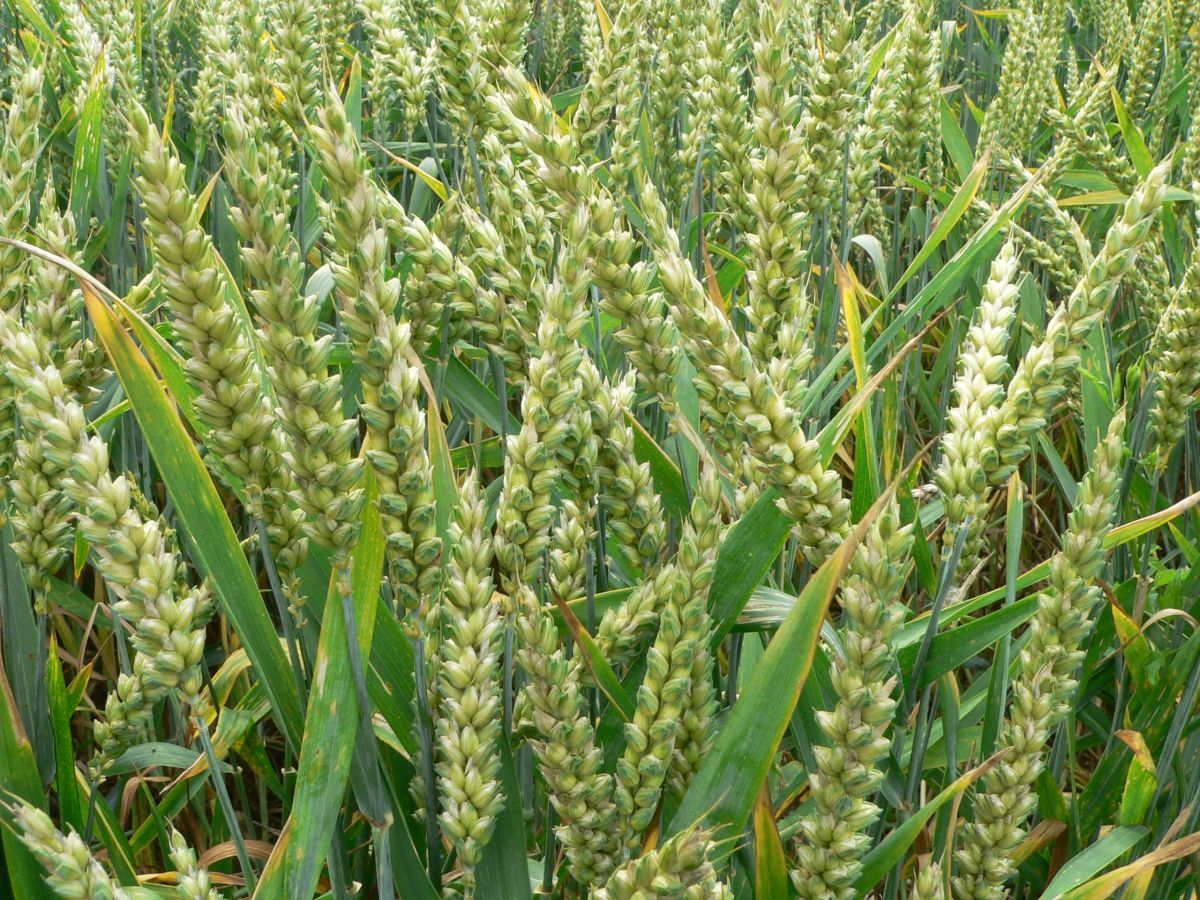
For the 10,166 wheat samples analysed by 31 August, the provisional average protein level was 12.6%.
However, at this early stage the results are based predominantly on nabim Group 1 & 2 varieties and are geographically biased towards Eastern and South Eastern England.
As with previous years, this bias means the results are liable to change as the rest of the GB crop is harvested and analysed.
James Webster, AHDB Cereals & Oilseeds Analyst added: "Compared with previous first provisional results as at 31 August, the current provisional protein values for wheat are the highest they have been at this stage for the past four years, and nearly 1% higher than the previous three-year average."
Another measure of the quality of the grain, the Hagberg Falling Number (HFN), has provisionally seen an increase on last year, at 319s in 2016 compared with 312s at this stage last year.
Within the wheat samples analysed, the provisional results represent the lowest specific weights for four years, with an overall average of 77.2Kg/hl.
This year is still well above the levels witnessed at the provisional stage in 2012 (71.9Kg/hl).
Skyfall is most notable within the nabim Group 1 varieties, which has once again achieved a specific weight and HFN above the Group 1 average, plus a protein level only 0.1% below the average.
Skyfall represents a large proportion (46%) of the Group 1 sample and also accounts for 23% of the total wheat data analysed at this stage.
As with previous years, the early provisional data has a regional bias towards the East and South East, representing 53% and 25% respectively of the total sample.
It is also worth noting that nabim Group 1 varieties account 51% of the total sample.
As such the current results are biased towards milling wheat varieties and are not a fair representation of the GB wheat crop as a whole.
As further data and releases are published the regional and varietal biases will be addressed.
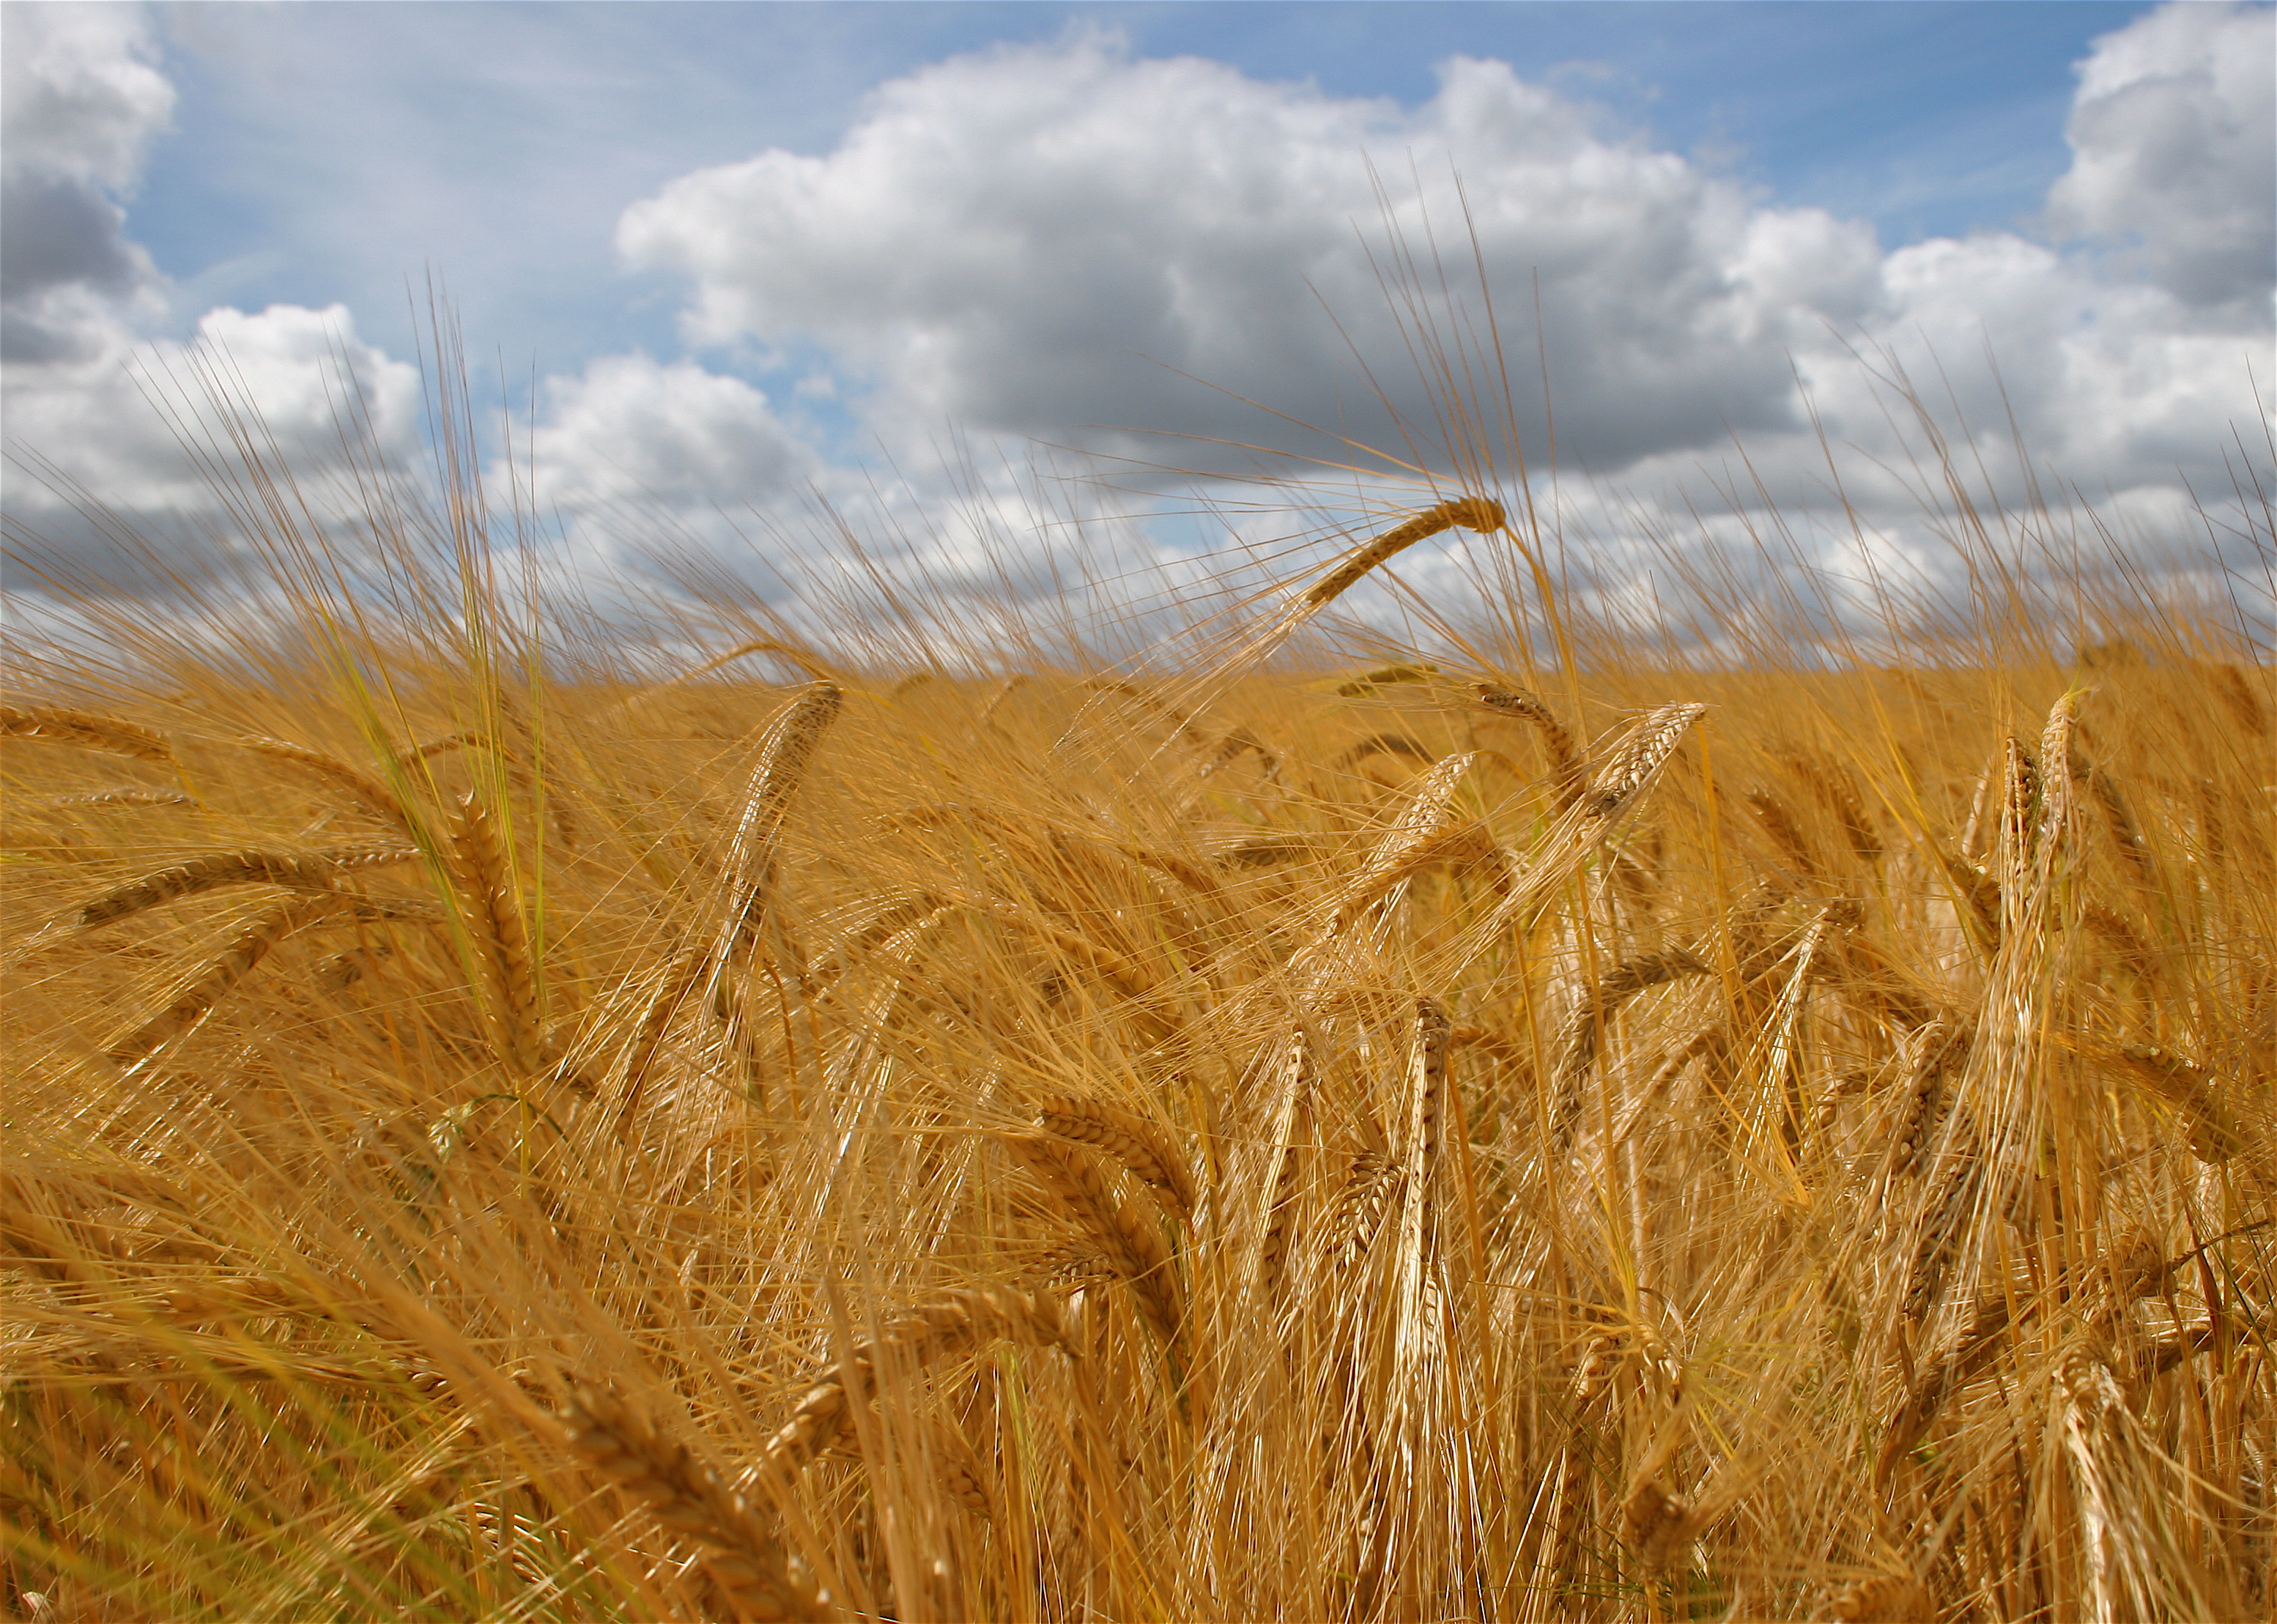
Barley
For barley, the provisional results indicate a smaller specific weight and grain size than seen in last year’s provisional results although there is a noticeable divide between winter and spring barley. Nitrogen content is above last year’s level.
The 11,502 barley samples analysed have revealed an average specific weight of 63.6Kg/hl across Great Britain.
The provisional screening data indicates a much smaller grain size than last year, with an average of 88.5% being retained by a 2.5mm sieve.
It is worth noting that there is large difference between winter and spring barley samples with retained levels of 85% and 92% respectively.
This data is in line with the ADAS harvest progress reports and AHDB Recommended Lists trials, which have also identified high screenings in some winter barley samples this year.
Finally, the provisional sample indicates an increase in the nitrogen levels on the same stage last year.
The provisional nitrogen content for the 2016 GB barley crop is 1.61%, versus 1.58% at the same point last year.
As with the wheat sample, the provisional barley results also demonstrate a regional bias towards the East and South East, representing 56% of the total sample.
The results are subject to change as further samples from other regions are collected and analysed.